Methodology
Process
Select municipalities (palikas) as a pilot project area chosen through the consultation with District Disaster
Management Committees (DDMCs), District Emergency Operation Centers (DEOCs), Nepal Red Cross
Society (NRCS) and District Lead Support Agencies (DLSAs). To review the existing data and identify the
data gaps, a scoping meeting organized with the municipals and agreed up on the database generation
and activities accordingly.
Through the scoping meetings, WFP field teams proposed to municipals to conduct a study on Emergency
Preparedness and Capacity Index (EPCI) but they, as per their need, suggested to the teams to go for
disaster risk assessment and generate the disaster related data sets at local levels to fill the data gap in
the municipalities. The scooping meeting also concluded that there should be a foreseen plan that should
be implemented right after the assessment. That's why WFP EPI study team realized that it should be jointly
conducted with EPR and Logistics unit.
Data Sources
Socio-economic, flooding nature and its impact, disaster preparedness and management related data
collected through FGDs and KII. Spatial data collected through OpenStreetMap and Department of
Survey of Government of Nepal .
Focused Group Discussion
Focus group discussion (FGD) is qualitative research approach to gain an understanding of social
issues. The main aim is to obtain data from a deliberately selected group of individuals rather than from a
statistically representative sample of a broader population. Considering geography, diversity of the
municipality and nature of floods, 2 to 3 FGDs were conducted in every ward of selected palikas to get the
in-depth insight of risk and vulnerability. Community people, community leaders, ward representatives,
ward members, members of teachers, social workers, Red Cross volunteers and old-aged people involved
in this process.
Key Informant Interview
The main purpose of key informant interviews (KII) is to collect information from the selected individuals
from the communities who are well-aware on the flood disaster, its nature and impact in the communities—
including teachers, community leaders, palika representatives, ward representatives and old aged people—
who have first-hand knowledge about the community.
Tools
Two sets of questionnaires developed for FGD and KII organized at each ward of the select municipalities.
KoBo Toolbox was used to record the information obtained through FGD and KII. Geographic Information
Systems (GIS) and Earth Observation Technology also used for hazard mapping and other spatial data
collection.

Indicators and normalization
Altogether 26 multidimensional indicators developed considering physical, social, economic,
demographic, emergency preparedness and disaster management aspects (see Annex….).
A Normalization technique (ICIMOD, District Development Indicators, 1997; UNDP, HDR 2004; MoFE, VRA
2021) adopted to transform the values of the indicators. Indicators selected for the assessment had different
units of measurement. For example, the number of affected communities were in number, weak buildings
in a particular ward were in percentage and distance to health centres was in minutes. These indicators
having different units could not be aggregated without normalization. The normalization technique allowed
to calculate the composite indices by transforming all the values into unitless values. The normalised values
of indicators had been transformed between 0 and 1.
Normalisation was done based on the functional relationship of an indicator to the respective components
of the risk assessment. Normalisation of indicators with negative and positive relationship with various
components was made using following equations.
Normalization of indicators with positive relationship to the components of vulnerability and risk
= (max min
…........ (equation 1)
Normalization of indicators with negative relationship to the components of vulnerability
and risk
= (max min
…........
(equation 2)
where,
dij = the score corresponding to xij of an indicator
Xij = the actual value of the j th indicator
min j = minimum value of the j th indicator
max j = maximum value of the j th indicator
Composite index was computed by using the following equation.
=
=
(equation 3)
where,
Cij = Composite index
n = number of observed indicators
Hazard mapping
Flood hazard prone areas detected through the use of Sentinel-1 image obtained during the flooding in
2017, 2019 and 2020, and also 25 years return period flood inundation area obtained from Global
Assessment Report (GAR) on Disaster Risk Reduction 2015 of United Nations Office for Disaster Risk
Reduction (UNISDR, GAR 2015).
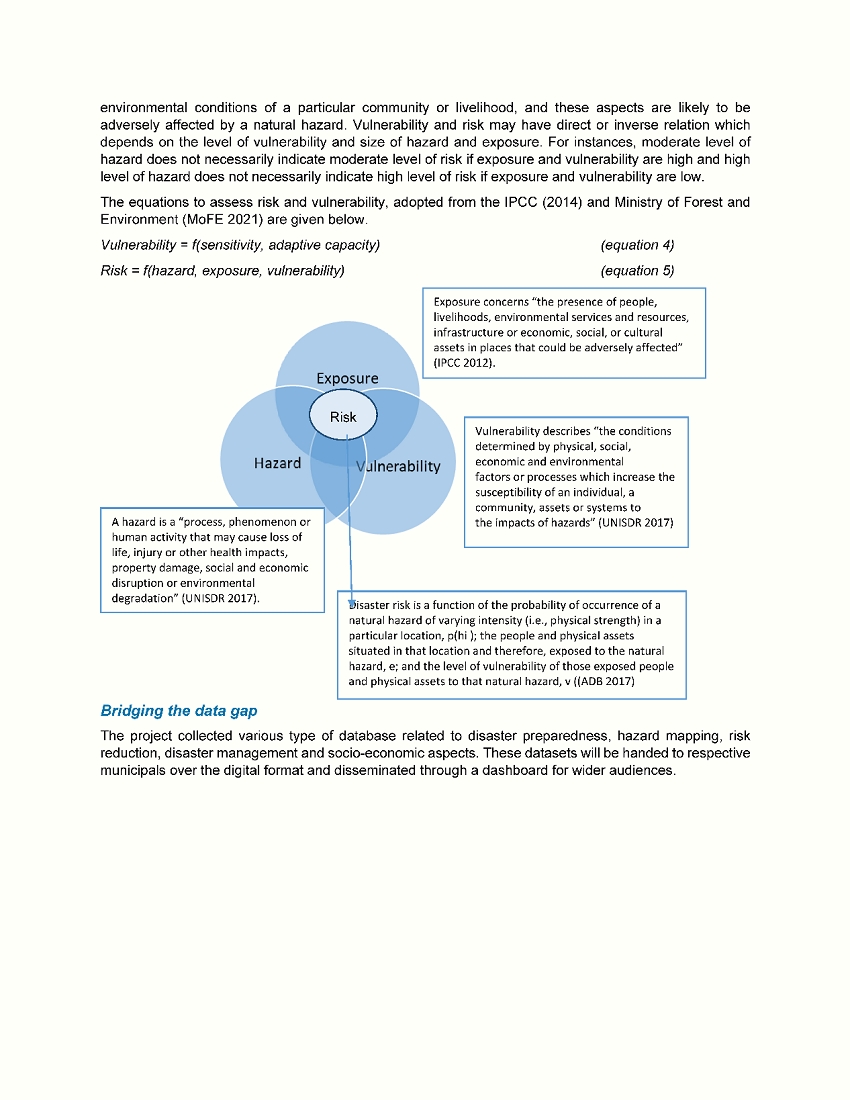
Vulnerability and risk assessment
Vulnerability is a natural or social system which is susceptible to or unable to cope with the adverse effects
of climate change (IPCC 2007). This concept has been replaced by the concept of risk of climate change
impacts that may harm a system (IPCC 2014). Risk is an interaction of the vulnerability, exposure, and
hazard. Thus, vulnerability is become one of the components of the risk which determines the potential
consequences of a natural hazard. Vulnerability is related to the physical, social, economic, and